
RAYPCB · RF ENGINEERING
PCB Antenna PIM: Interfaces, Materials & Test Conditions
Passive intermodulation, or PIM, is unwanted mixing generated by nonlinear behavior in components or interfaces normally treated as passive. In an antenna assembly, contacts, materials, contamination, mechanical conditions and nearby structures can contribute. A good impedance match does not establish low PIM, because reflection and nonlinear mixing are different properties.
This page focuses on identifying relevant mixing frequencies, documenting the assembly and defining a useful test. It does not predict PIM amplitude from a PCB material name or certify an antenna using a two-frequency calculator.
Separate frequency arithmetic from amplitude prediction
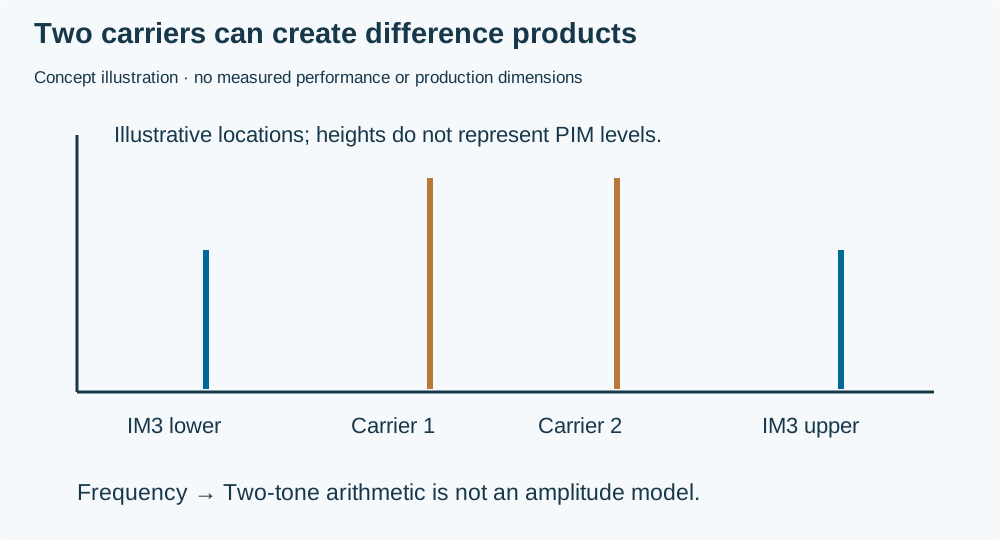
For two input tones, common third-order mixing products include two times the first frequency minus the second, and two times the second minus the first. Their locations can be calculated from the tone frequencies. Their amplitudes cannot be obtained from those frequencies alone; they depend on the nonlinear mechanisms, signal levels and physical system.
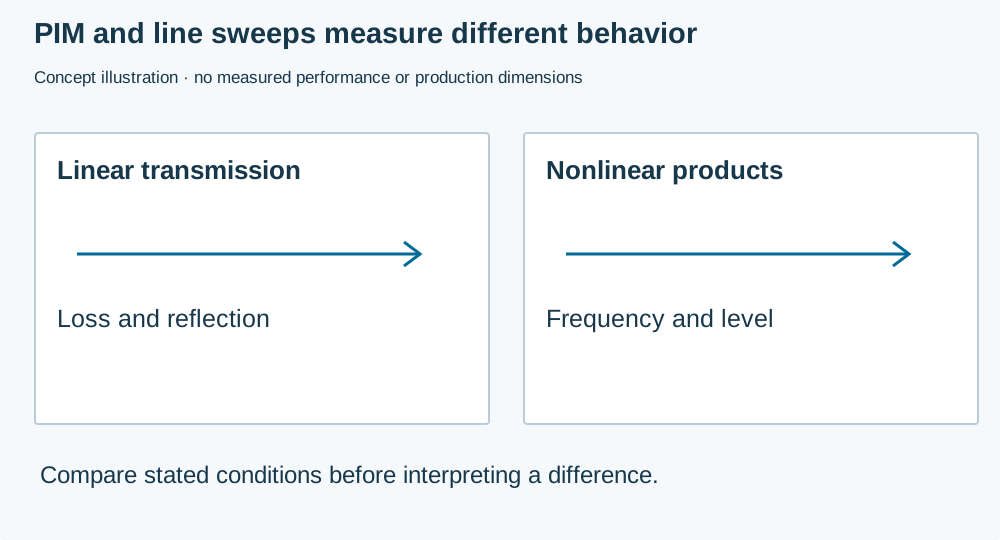
Anritsu's PIM technical overview explains two-tone testing and distinguishes it from impedance-based line sweeps. Use that distinction when planning evidence. Passing one type of test does not make the other redundant.
For real modulated signals and several carriers, the problem is more complex than two narrow spectral lines. The simple calculator on this page is a planning aid for two-tone frequency locations. It does not predict the spectrum of a complete cellular or radio installation.
Check where IM3 products fall
The worksheet runs locally in your browser with JavaScript. You can contact RAYPCB directly without completing it.
Two-tone IM3 frequency planner
Enter two carrier frequencies and an optional receiver interval. The worksheet calculates the positive-frequency locations corresponding to the two difference products and flags whether either falls inside the entered interval. It does not calculate dBm, dBc, receiver desensitization or compliance with a PIM requirement.
An illustrative pair of 900 MHz and 950 MHz produces difference-product locations at 850 MHz and 1000 MHz. Whether either location matters depends on the actual receiver filtering, operating configuration and generated level. These example numbers are arithmetic only, not a recommended test configuration or a claim about a particular product.
If a calculated product lies outside the receiver interval, that does not prove the installation is free of interference. Other orders, other carriers, modulation and other coupling mechanisms may still matter. Keep the limited purpose of the two-tone check visible in the engineering record.
Identify interfaces that deserve review
| Assembly feature | Information to record | Evidence needed |
|---|---|---|
| RF connectors | Exact parts, contact condition and installation instructions | Controlled assembly and appropriate test record |
| Mechanical joints | Materials, finishes, pressure and environmental exposure | A justified contact design and repeatable installation |
| PCB and radiator | Construction, finish and relevant interfaces | Representative assembly data rather than a generic material claim |
| Cables and fixtures | Parts, routing and residual test behavior | Setup verification before attributing a result to the DUT |
| Nearby structures | Conductive objects in the installed environment | Review of external sources when the test scope includes them |
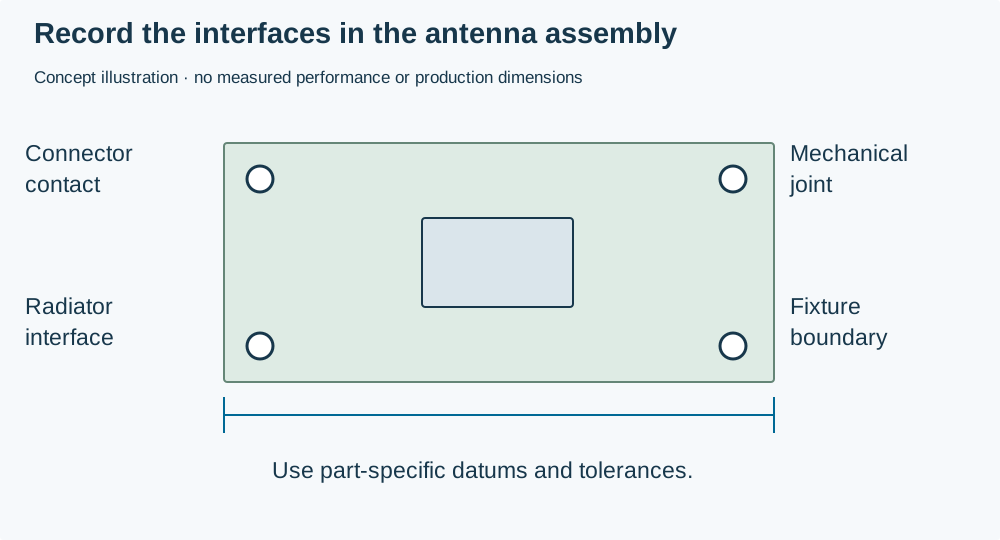
The table is a review map, not a list of guaranteed PIM causes. A suspected interface must be investigated under controlled conditions. Do not replace evidence with assumptions based solely on appearance or a material category.
Keep PIM separate from linear loss and matching
A linear network can attenuate or reflect a signal without generating new mixing products. PIM concerns nonlinear behavior. A change that improves return loss may leave PIM unchanged, and a PIM issue may exist in an otherwise acceptable line sweep. Test and interpret the relevant properties separately.
Similarly, a copper roughness discussion does not substitute for a PIM assessment. Roughness models commonly address conductor loss and propagation behavior under their assumptions. They do not establish the nonlinear behavior of every joint, finish or assembly interface.
Use the copper and signal-integrity guide for conductor-loss questions. Keep the PIM record focused on the actual assembly, excitation and nonlinear measurement conditions.
Define the test before writing a limit
Record tone frequencies, power at the defined reference plane, measured intermodulation order, forward or reverse configuration, instrument settings and the physical arrangement. State the required limit and its units. A PIM number without the excitation and measurement definition is not a complete specification.
Be explicit about dBm and dBc. A dBm result is an absolute power level at a stated point. A dBc result is relative to a declared carrier reference. The chosen reference and any path-loss correction must be clear. Do not compare two dBc figures when their carrier references or test powers differ without accounting for those conditions.
Use appropriate equipment and a qualified test procedure for the required RF power and configuration. This page does not instruct an operator to assemble a high-power test from generic components. The test organization's procedure should cover the instrument, loads, connections and operating controls for that setup.
Establish the setup's residual contribution
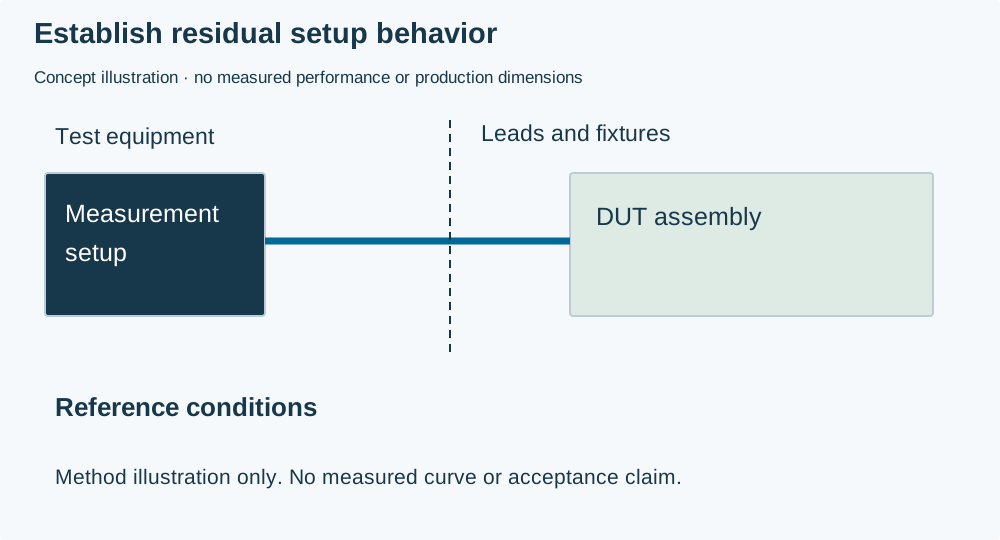
Before blaming the device under test, verify the test leads, connectors, loads and fixture under the relevant conditions. A setup can contribute nonlinear products or limit the measurement. Keep its baseline and any residual checks with the DUT results.
Anritsu's PIM measurement user guidance includes instrument-specific setup and connector inspection steps. Follow the manual for the actual instrument and configuration rather than combining procedures from unrelated models.
Record any mechanical disturbance or environmental condition included in the test. If the purpose is to evaluate installation repeatability, define the reassembly sequence and what is reused. An unexplained change after handling is a clue that needs investigation, not proof of a single identified defect.
Investigate changes without losing the baseline
Suppose a connector reinstallation changes the measured PIM result. Preserve both records with the installation details and verify the setup. Inspect the relevant parts according to their supplier instructions. Avoid simultaneously changing the cable, connector and board if the immediate goal is to identify the source.
If a redesigned contact or material combination improves the result, repeat the appropriate test across representative assemblies and conditions before making a production claim. A favorable one-off measurement can support further development without establishing manufacturing consistency.
Keep the exact approved combination of parts, finishes and assembly instructions. Purchasing substitutions or altered mechanical hardware can change interfaces that the electrical schematic does not show. This is why PIM-sensitive construction needs a controlled assembly record, not only Gerber files.
Connect the antenna design to the installed system
An antenna PCB is part of a larger RF path with connectors, cables and mounting structures. Define which of those elements are included in the requested performance and test scope. If the installed environment is relevant, describe it rather than qualifying a bare board and extending the claim to an entire installation.
For antenna construction, use antenna PCB manufacturing. For a high-frequency board build, use RF PCB manufacturing. The broader PCB Manufacturing route covers fabrication scope, while the PIM requirement remains a separately defined acceptance item.
Prepare a PIM-aware enquiry
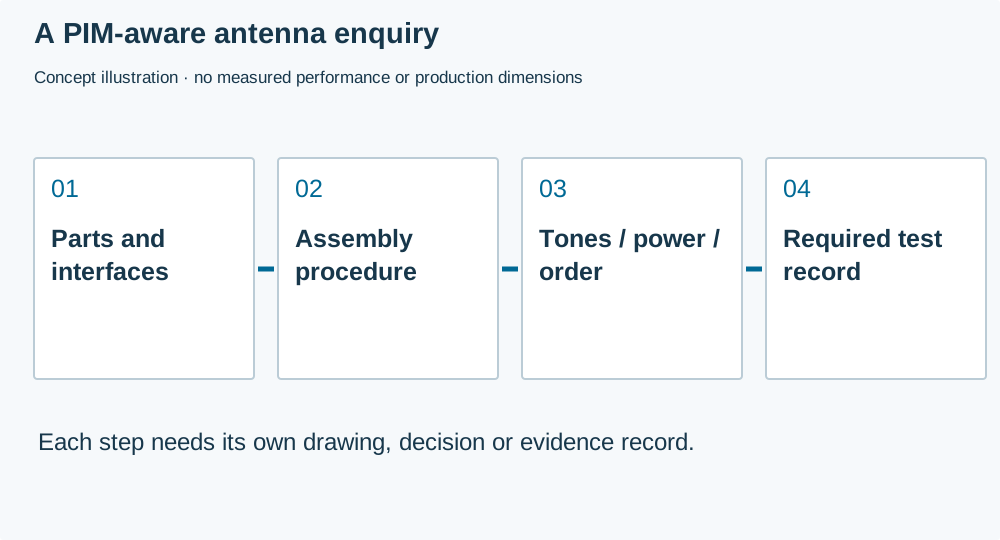
Provide the board and assembly revision, antenna construction, connector and cable parts, material and finish requirements, installation instructions and requested quantities. Include the test definition, limit, reference plane and any existing data. State who supplies the test procedure and who is responsible for the measurement.
You can discuss the antenna build requirements before every test detail is finalized, provided the open items are visible. Do not assume that an ordinary RF PCB quote includes PIM testing, a particular power capability or a certified low-PIM assembly process unless that scope is explicitly agreed.
PIM planning questions
Can IM3 frequency predict whether a product passes?
No. Frequency arithmetic identifies possible product locations. Passing a requirement depends on the measured level and the complete specified test conditions. The worksheet intentionally returns no amplitude or pass verdict.
Does low insertion loss imply low PIM?
No. Linear transmission loss and nonlinear mixing are different properties. Use the appropriate test for each and preserve the conditions. A good line sweep is useful evidence but does not replace a PIM measurement when PIM is required.
Can material selection alone solve every PIM problem?
No. Contacts, assembly, contamination, mechanical conditions and the test environment can matter. Select materials within a controlled design and investigate the actual mechanism. Avoid attributing an assembly-level result to one material without supporting evidence.
What makes two PIM results comparable?
Match the excitation frequencies and levels, order, direction, reference plane, processing and assembly state, or explain the differences. Keep the setup baseline and unit convention. Without that context, two attractive numbers may describe different experiments.
Engineering guide · Content prepared 1 October 2026. Diagram and example labels distinguish explanations from product or test evidence.